Dashboards explained
Do you want to get an overview of the most important performance indicators that are relevant to a certain goal or business process within your organization? This is possible with the different dashboards that eConnect has. With our graphical user interface it is possible to easily see who invoices have been sent to and from whom they have been received. This is also easy to filter by a specific period. To do this, you need to click on an app of your choice on the left side of your screen. We use the sales invoice app as an example here. After clicking on the sales invoice app, you automatically start in the Dashboard of the Sales Invoices. This shows how much and in what month you sent sales invoices. If you haven't sent invoices yet, this will be empty.
Sales invoice app
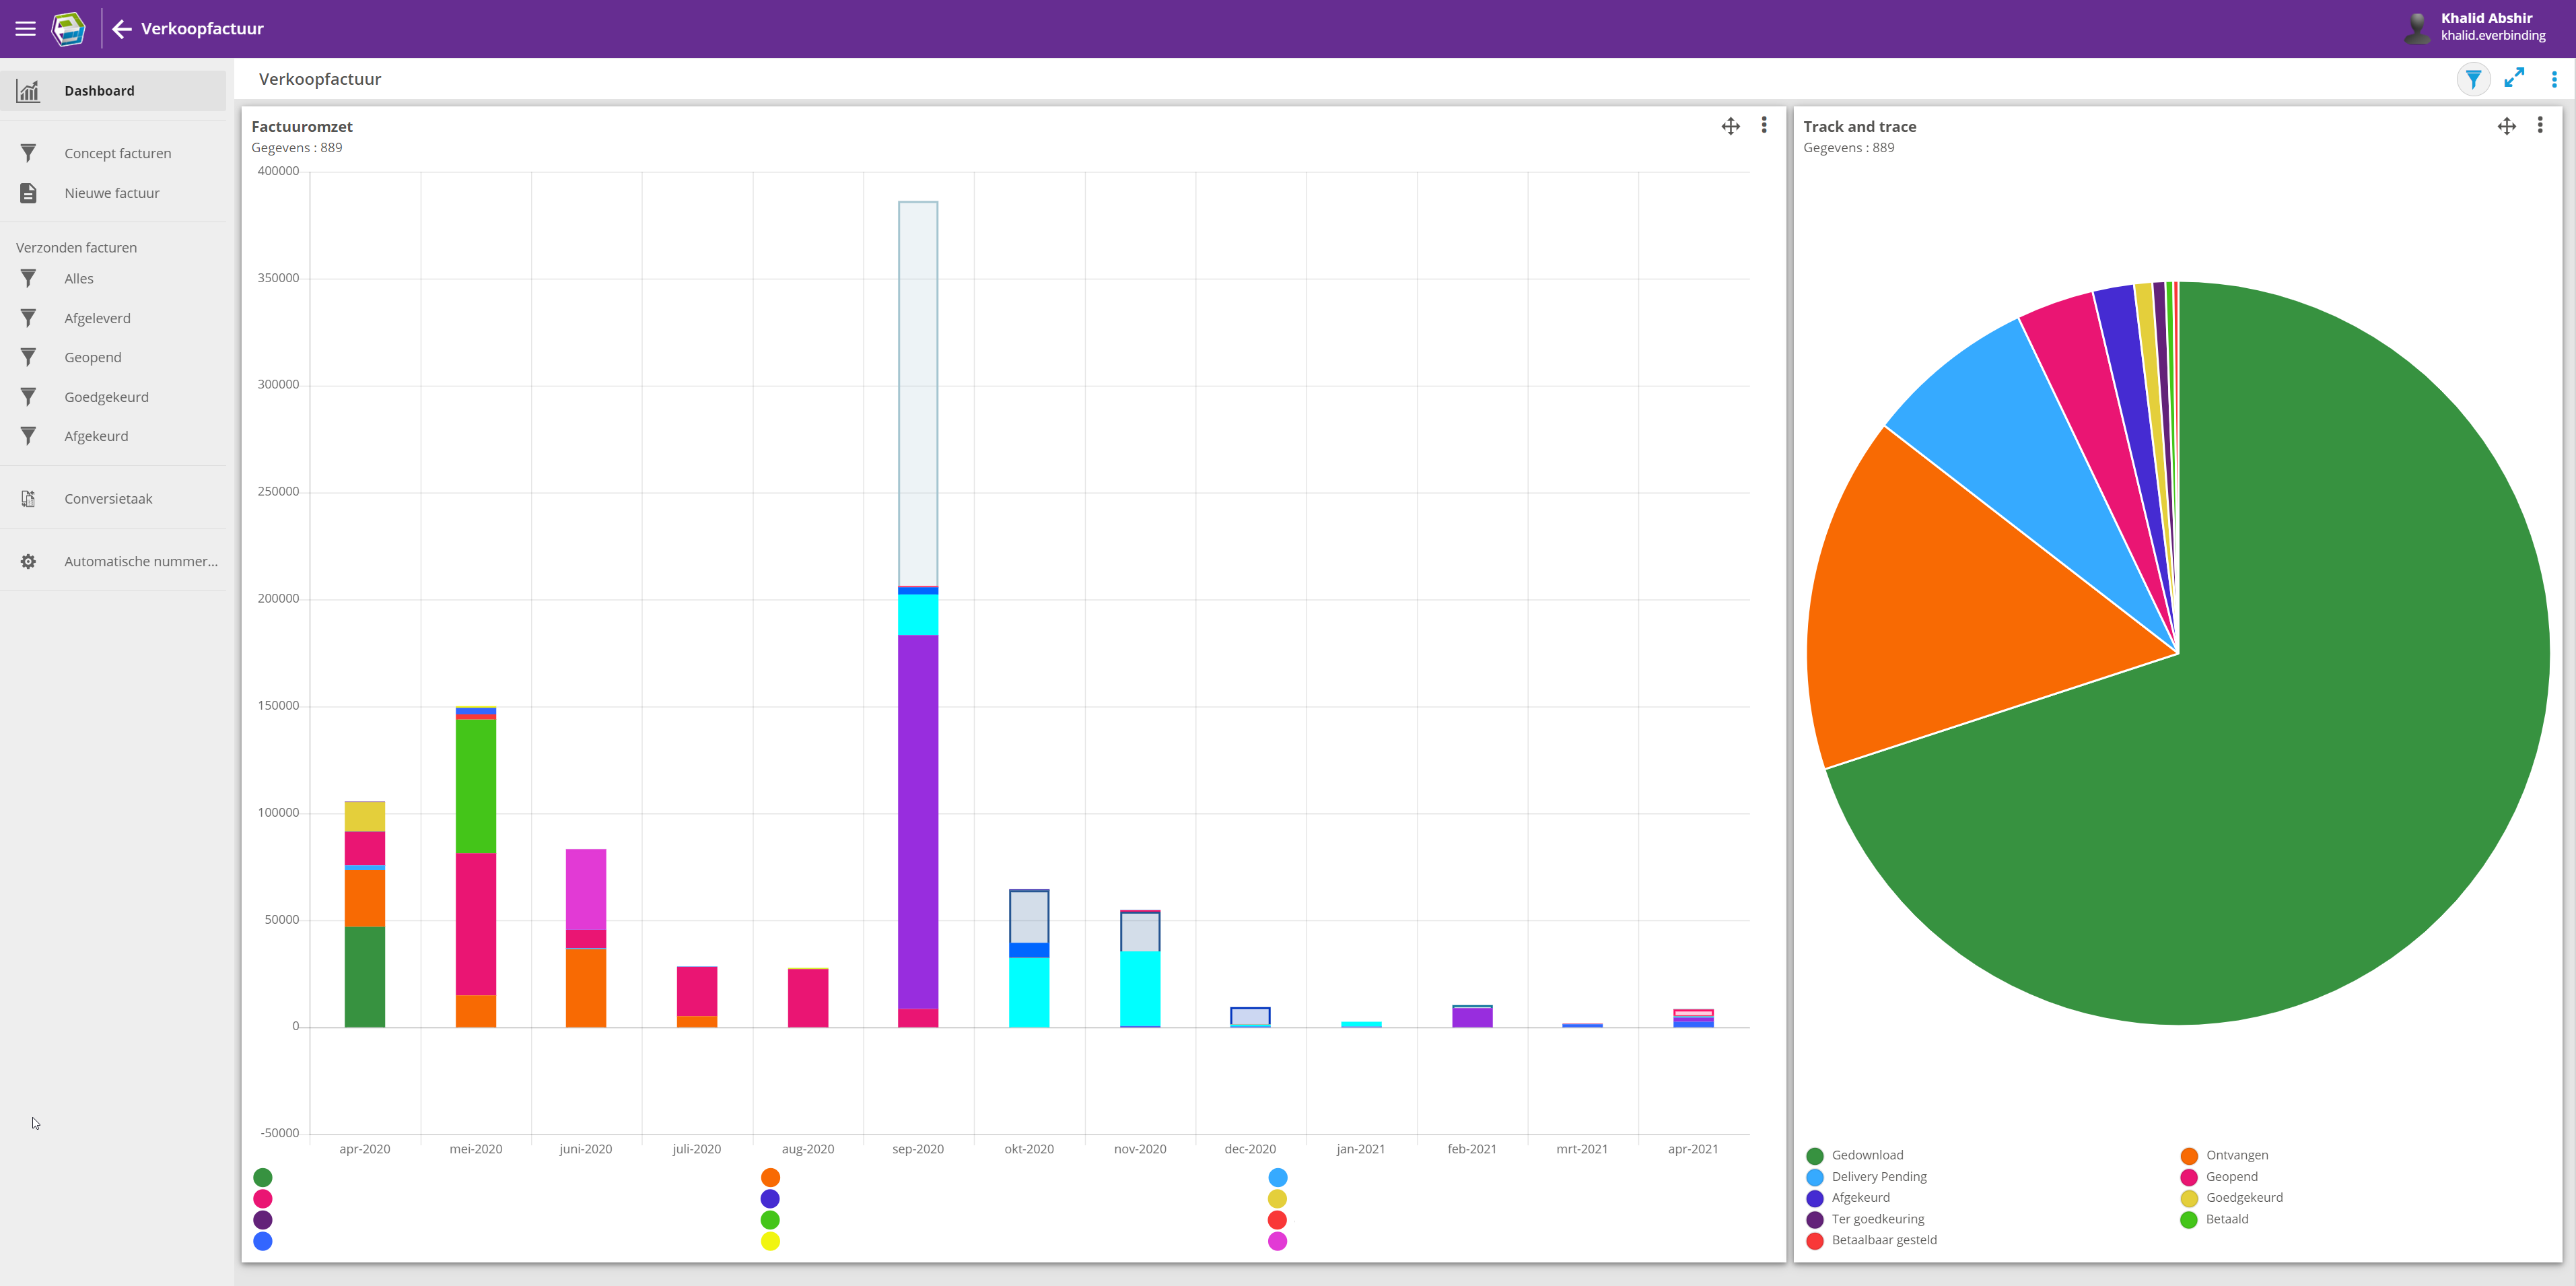
As you can see below, the dashboard of the sales invoice app is equipped with a chart with the invoice move showing how many invoices have been sent and to whom. You also have a Diagram containing a Track & Trace of the statuses of each invoice.
It is also possible to filter by date if desired. Click on the purple funnel at the top right, where you can choose from the different filter options.
Purchase invoice app
For the app purchase invoices there is of course also a Dashboard. When you click on the app, you will see it as below. By default, you will see multiple circle diagrams showing the different statuses. You can also filtering here, for example by date.
Other apps
Related Articles
Release Notes Platform
Update 26.07.0 A platform update was deployed on Friday, July 24th, 2026 at 3:00 AM CET without downtime. What's New Extended dynamic VAT loading for Invoice and Order app Added additional VAT rates to dynamic VAT loading in the Invoice and Order ...